Ichimoku II Haloubi

Ichimoku II Haloubi
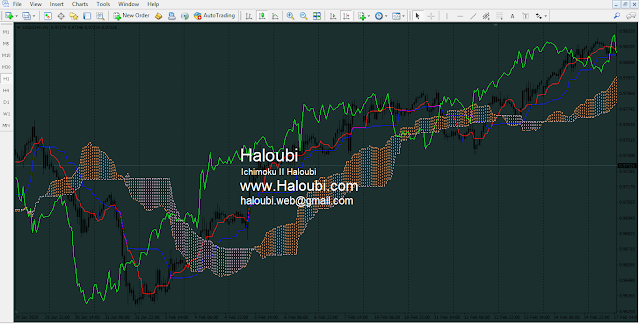
Ichimoku II Haloubi Technical Indicator is predefined to characterize the market Trend, Support and Resistance Levels, and to generate signals of buying and selling. This indicator works best at weekly and daily charts
When defining the dimension of parameters, four time intervals of different length are used. The values of individuallines composing this indicator are based on these intervals
Tenkan-sen shows the average price value during the first time interval defined as the sum of maximum and minimum within this time, divided by two
Kijun-sen shows the average price value during the second time interval
Senkou Span A shows the middle of the distance between two previous lines shifted forwards by the value of the second time interval
Senkou Span B shows the average price value during the third time interval shifted forwards by the value of the second time interval
Chikou Span shows the closing price of the current candle shifted backwards by the value of the second time interval. The distance between the Senkou lines is hatched with another color and called "cloud". If the price is between these lines, the market should be considered as non-trend, and then the cloud margins form the support and resistance levels
If the price is above the cloud, its upper line forms the first support level, and the second line forms the second support level
If the price is below cloud, the lower line forms the first resistance level, and the upper one forms the second level
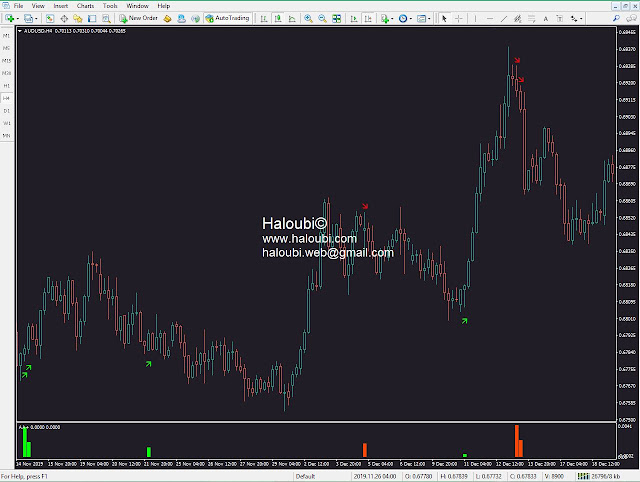
If the Chikou Span line traverses the price chart in the bottom-up direction it is signal to buy. If the Chikou Span line traverses the price chart in the top-down direction it is signal to sell
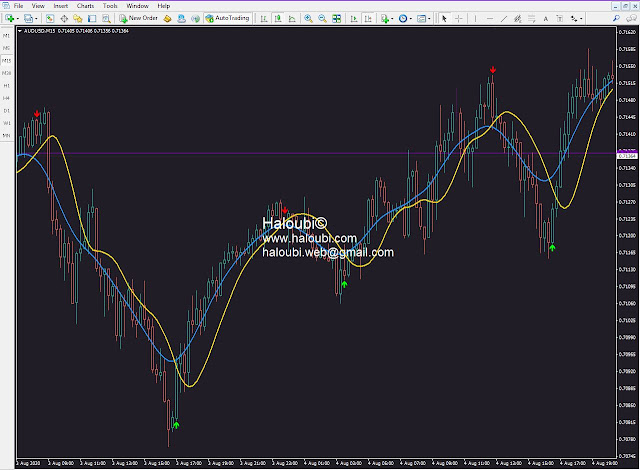
Kijun-sen is used as an indicator of the market movement. If the price is higher than this indicator, the prices will probably continue to increase. When the price traverses thisline the further trend changing is possible
Another kind of using the Kijun-sen is giving signals. Signal to buy is generated when the Tenkan-sen line traverses the Kijun-sen in the bottom-up direction. Top-down direction is the signal to sell
Tenkan-sen is used as an indicator of the market trend. If this line increases or decreases, the trend exists. When it goes horizontally, it means that the market has come intothe channel
Contact us
__________________________
تم تحديد مؤشر Ichimoku II Haloubi الفني مسبقًا لتمييز اتجاهات السوق ومستويات الدعم والمقاومة ، ولتوليد إشارات الشراء والبيع. يعمل هذا المؤشر بشكل أفضل على الرسوم البيانية الأسبوعية واليومية.
عند تحديد أبعاد المعلمات ، يتم استخدام أربع فترات زمنية ذات أطوال مختلفة. تستند قيم الفرديين المكونة لهذا المؤشر إلى هذه الفترات الزمنية:
يعرض Tenkan-sen متوسط قيمة السعر خلال الفترة الزمنية الأولى المحددة على أنها مجموع الحد الأقصى والحد الأدنى خلال هذا الوقت ، مقسومًا على اثنين ؛
يظهر Kijun-sen متوسط قيمة السعر خلال الفترة الزمنية الثانية ؛
يُظهر Senkou Span A منتصف المسافة بين خطين سابقين تم تحريكهما للأمام بقيمة الفاصل الزمني الثاني ؛
يعرض Senkou Span B متوسط قيمة السعر خلال الفترة الزمنية الثالثة التي تحولت إلى الأمام بمقدار قيمة الفترة الزمنية الثانية.
يوضح Chikou Span أن سعر إغلاق الشمعة الحالية تحول للخلف بقيمة الفاصل الزمني الثاني. المسافة بين خطوط Senkou مظللة بلون آخر وتسمى "سحابة". إذا كان السعر بين هذه الخطوط ، فينبغي اعتبار السوق غير اتجاه ، ومن ثم تشكل هوامش السحابة مستويات الدعم والمقاومة.
إذا كان السعر فوق السحابة ، يشكل خطه العلوي مستوى الدعم الأول ، ويشكل الخط الثاني مستوى الدعم الثاني ؛
إذا كان السعر أقل من السحابة ، يشكل الخط السفلي مستوى المقاومة الأول ، والخط العلوي يشكل المستوى الثاني ؛
إذا اجتاز خط Chikou Span مخطط السعر في الاتجاه من أسفل إلى أعلى ، فإنه يشير إلى الشراء. إذا اجتاز خط Chikou Span مخطط السعر في الاتجاه من أعلى إلى أسفل ، فإنه يشير إلى البيع.
يستخدم Kijun-sen كمؤشر لحركة السوق. إذا كان السعر أعلى من هذا المؤشر ، فمن المحتمل أن تستمر الأسعار في الارتفاع. عندما يتجاوز السعر هذا الخط ، يمكن تغيير الاتجاه.
نوع آخر من استخدام Kijun-sen هو إعطاء إشارات. يتم إنشاء إشارة للشراء عندما يجتاز خط Tenkan-sen Kijun-sen في الاتجاه الصعودي. الاتجاه من أعلى لأسفل هو إشارة للبيع.
يستخدم Tenkan-sen كمؤشر لاتجاه السوق. إذا زاد هذا الخط أو انخفض ، فإن الاتجاه موجود. عندما يذهب أفقيا ، فهذا يعني أن السوق قد وصلت إلى القناة.

تعليقات
إرسال تعليق